Debug with GDB
The GNU Debugger (GDB) is used by developers to introspect the execution environment of an app, revealing both its code and data state at any point. Developers can use GDB to debug snaps locally and remotely.
This guide covers how to set up and start a GDB session for snap debugging. For specific guidance on the tool’s debugging features, see the GDB documentation.
Generate debug symbols
Most snaps don’t ship with apps that include debug symbols. While GDB can be used without debug symbols, debugging is more difficult because function names, variable names, and source code won’t be available. To use GDB effectively, you need to build and install the snap locally with debug symbols enabled.
For example, to enable debug symbols for a typical C-based project using the
CMake plugin, add set(CMAKE_BUILD_TYPE Debug)
to the project’s CMakeLists.txt, then rebuild and install the snap.
Locally debug a snap
Snaps are run within a confined environment, so running GDB directly against a snap app would introspect both the snapd runtime environment and the app itself, making the identification of any issues specific to the snap app difficult. For this reason, snapd encapsulates GDB within its own runtime.
Run GDB directly against an installed snap with:
snap run --gdb <snap>
When running on an app with debug symbols, the symbols will be located and the source code can be referenced, as demonstrated below:
crafter@home:~$ snap run --gdb test-gdb.test-gdb[...]You are right before your application is execed():- set any options you may need- use 'cont' to start[...](gdb) dir test-gdb/src/Source directories searched: test-gdb/src:$cdir:$cwd(gdb) list1 #include <stdio.h>23 int main (int argc, char *argv[])4 {5 printf ("GDB from a snap is working\n");67 return 0;8 }(gdb) contContinuing.GDB from a snap is working[Inferior 1 (process 153259) exited normally](gdb) quitWhen GDB is instantiated by snapd, it behaves just as it would if it was called against the same app outside of the snapd runtime environment.
Locally debug with gdbserver
In addition to GDB, snapd integrates with gdbserver for remote access. With it you can debug snaps with GDB through an IDE on the same host.
To start a gdbserver session with a local snap, run:
snap run --gdbserver <snap>
This enters a gdbserver shell:
crafter@home:~$ snap run --gdbserver test-gdbWelcome to "snap run --gdbserver".You are right before your application is run.Please open a different terminal and run: gdb -ex="target remote :43041" -ex=continue -ex="signal SIGCONT"(gdb) continueYou can specify a port when starting the gdbserver. For example, to use port 43041, run:
snap run --gdbserver=:<port> <snap>
The GDB session can now be accessed from an IDE or GDB itself:
crafter@home:~$ gdb -ex="target remote :43041"GNU gdb (Ubuntu 12.1-0ubuntu1~22.04) 12.1[...](gdb)Remotely debug with gdbserver
To debug a snap remotely, first start a gdbserver session on the remote system via ssh. This can be done by passing the command to ssh directly:
ssh <user>@<host> "sudo snap run --gdbserver=:<port> <snap>"
To connect to the remote gdbserver session, pass the remote system’s IP and the port used by gdbserver:
gdb -ex="target remote <ip>:<host>"
For example, to connect to a gdbserver session at 192.168.122.138 on port 43041:
crafter@home:~$ gdb -ex="target remote 192.168.122.138:43041"Welcome to `snap run --gdb`.You are right before your application is execed():- set any options you may need- (optionally) set a breakpoint in 'main'- use 'cont' to startDebug with VS Code and gdbserver
Visual Studio Code can debug snaps like most IDEs, but it needs extra configuration to access the snap gdbserver session. You can also configure it to automatically start the snap with gdbserver when the debugger starts.
To remotely debug a snap with VS Code, you need a workspace with the C/C++ VS Code extension installed. Additionally, you need local access to the snap’s source code and the app.
To start, extract the app from the snap with:
unsquashfs <snap-file>
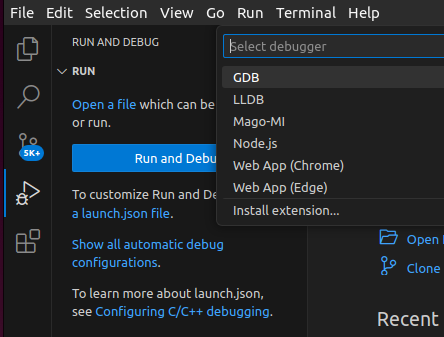
In VS Code, open your workspace. Click Run and Debug in the Activity Bar, and then create a launch.json file. Select GDB from the list of debuggers.
This will open a template launch.json file in the editor which can be configured to
access the remote snap GDB session. Replace the contents of this file with the following
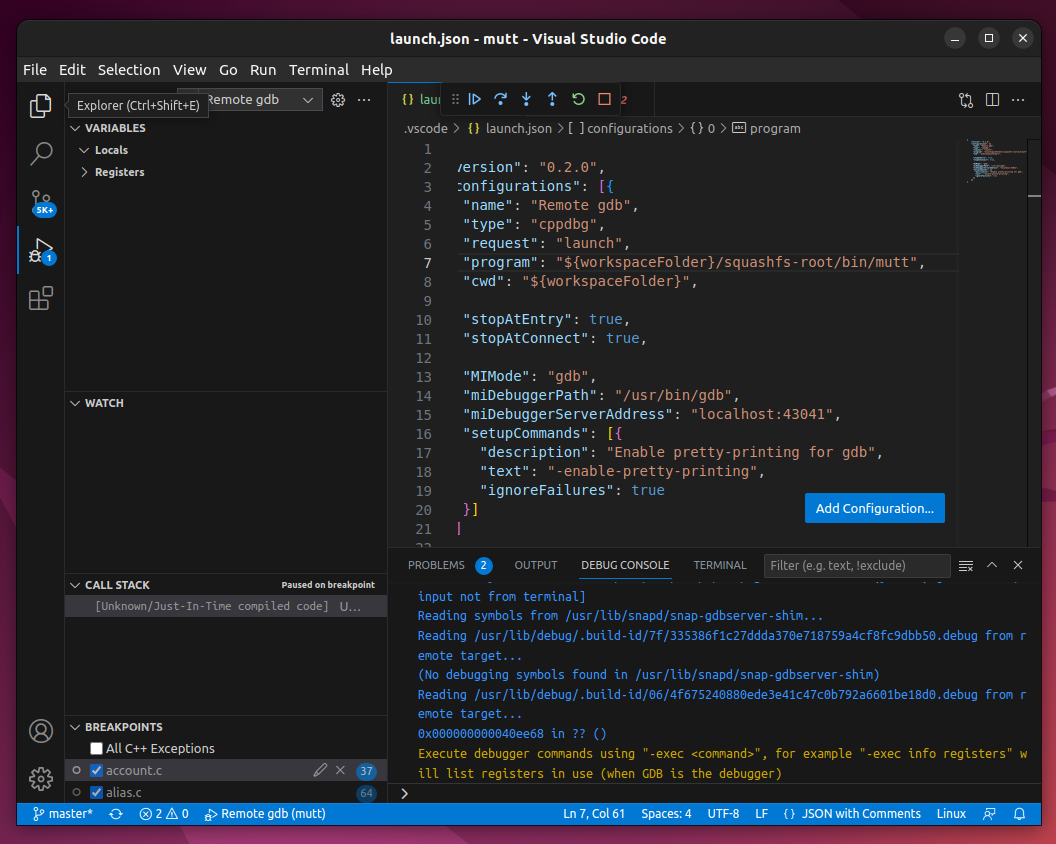
JSON to create a new entry called Remote gdb:
{
  "version": "0.2.0",
  "configurations": [{
    "name": "Remote gdb",
    "type": "cppdbg",
    "request": "launch",
    "program": "${workspaceFolder}/squashfs-root/bin/my-app",
    "cwd": "${workspaceFolder}",

    "stopAtEntry": true,
    "stopAtConnect": true,

    "MIMode": "gdb",
    "miDebuggerPath": "/usr/bin/gdb",
    "miDebuggerServerAddress": "192.168.122.138:43041",
    "setupCommands": [{
      "description": "Enable pretty-printing for gdb",
      "text": "-enable-pretty-printing",
      "ignoreFailures": true
    }]
  }]
}
The profile uses the target IP address and port of 192.168.122.138:43041. Modify the
address and port to point to your gdbserver. If gdbserver is running locally, you can
use localhost:<port>. The program key needs to point at the app in the
snap you wish to debug.
Save the file and set a breakpoint in the code before returning to the Run and Debug
window. You should now see the option to run the new remote GDB profile:
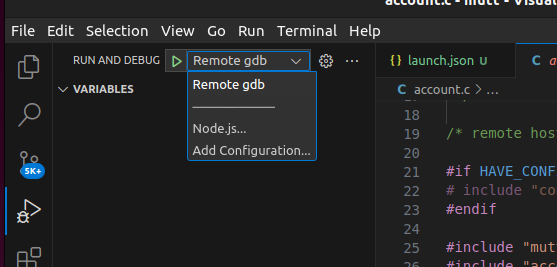
Press play to connect to the gdbserver session. You can now debug a running snap just as you would a normally built app.